About the Canvas
The features described in this section are currently in beta testing and are subject to change. We recommend that you don't use the features in production systems.
Add assets, engineering diagrams, sensor data, images, work orders (events), and 3D models from your Cognite Data Fusion (CDF) project to a canvas. Visualize and explore data from different data sets, leave comments, and mention people to collaborate with your coworkers.
Get started
Navigate to
Canvason the CDF homepage.Create a canvas or toggle between Private and Public to open existing canvases.
- A private canvas is only visible to you.
- Use Share to make a canvas public.
Select Add data to add and connect files, time series, assets, events, and 3D models. You can also drop local .pdf files and images directly onto a canvas.
Select Open canvas history to see and restore previous versions of a canvas. You can't edit previous canvas versions. Canvas checks for updates every 5 minutes.
To re-use a canvas, duplicate it from the overview page or select ... on a canvas.
Explore and collaborate
To explore the items on a canvas and to collaborate with your coworkers:
Select the Spacebar key and use the mouse to pan, or use two or more fingers on a touchpad.
Select and drag to move items on the canvas.
Use the zoom controls, the scroll wheel on a mouse, or pinch and stretch on a touchpad to zoom in and out.
Select any item on the canvas to see options for changing labels, finding related data, and opening the
Data Explorer.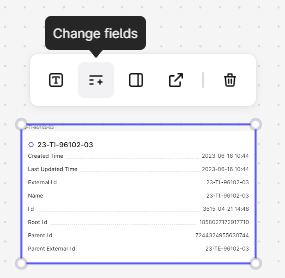
Select Change fields to select which properties to display for assets and events, such as work orders. For time series, select a time frame to navigate between current and historical data or set a specific date. Select Apply to all time series in a canvas to use the time frame for all times series on the canvas. You can open time series in
Charts.Use the canvas toolbar to add text, sticky notes, shapes, and lines.
Layer canvas items and right-click to send items to the front or back.
Open the copilot (
 ) within a document to get help using AI to find or summarize information.
Use the comment button on the toolbar to add comments and mention (@name) coworkers. You'll get an email if someone mentions you in a comment. Open the Comments panel (
 ) to see all comments.
 Lock the canvas to prevent unwanted changes with Lock canvas under the More options (...) icon.
When you've finalized your work on the canvas, download a .pdf file, for instance, for evidence and conclusions. All the items you've added to the data, such as text, shapes, and sticky notes, are included.
Options from engineering diagrams
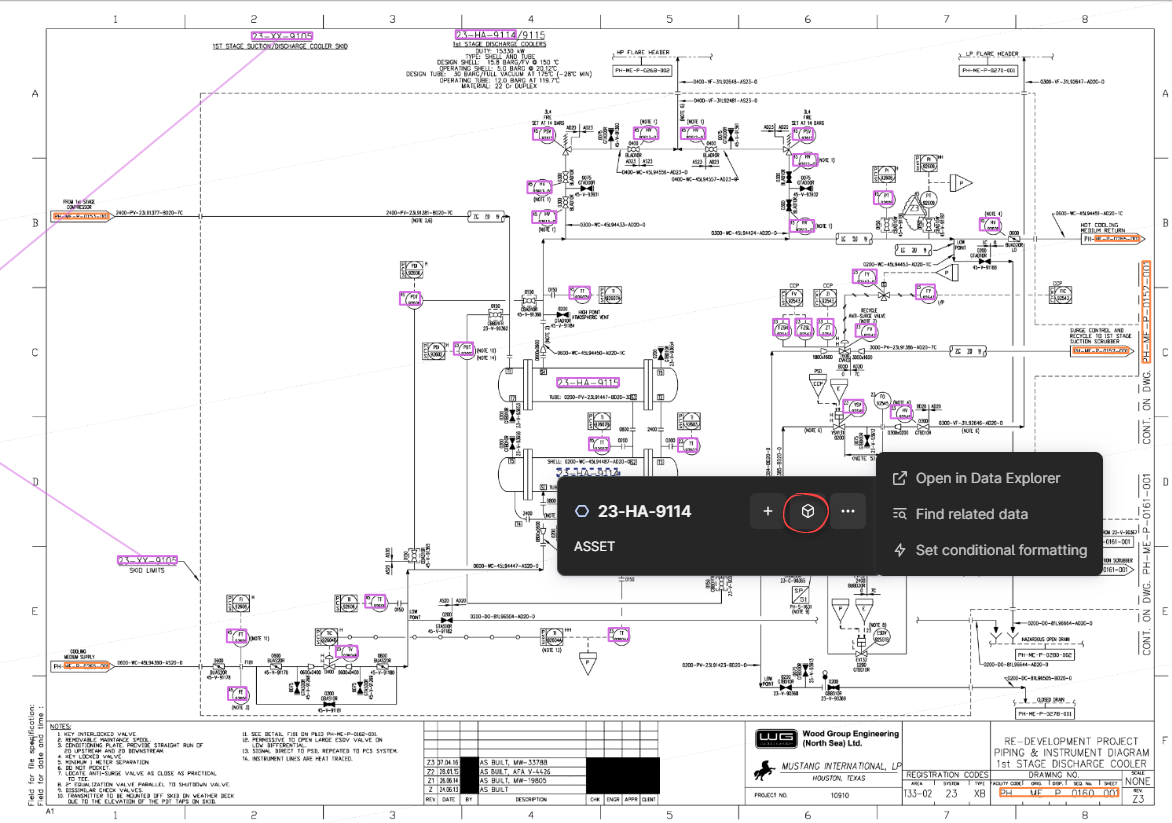
Select the purple or orange links and the plus sign (+) to add related engineering diagrams, assets, files, and time series. For assets on an engineering diagram, you can:
- View live sensor data by pinning a time series connected to the asset to the canvas. Add rules to set threshold values, for instance, temperatures, and use colors to visualize any breaches.
- If there's a 3D model connected to the asset, select the 3D icon to open the 3D view.
Troubleshoot
If you can't add comments or mention coworkers, check with your internal help desk or CDF admin that user profiles are enabled for the CDF project.